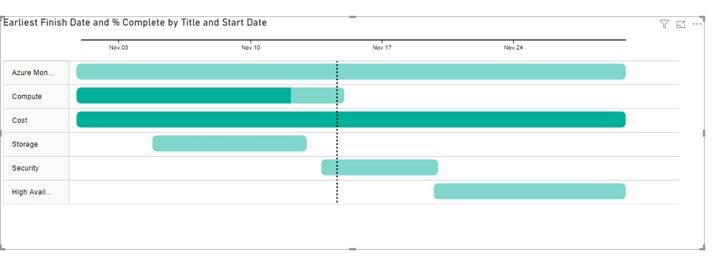
usually we use Gantt chart to track the project progress, take the picture blew for example, the dark part means completed, the light part means waiting for being done.
To reach this result, there are two solutions. The steps in azure devops are same for both solutions.
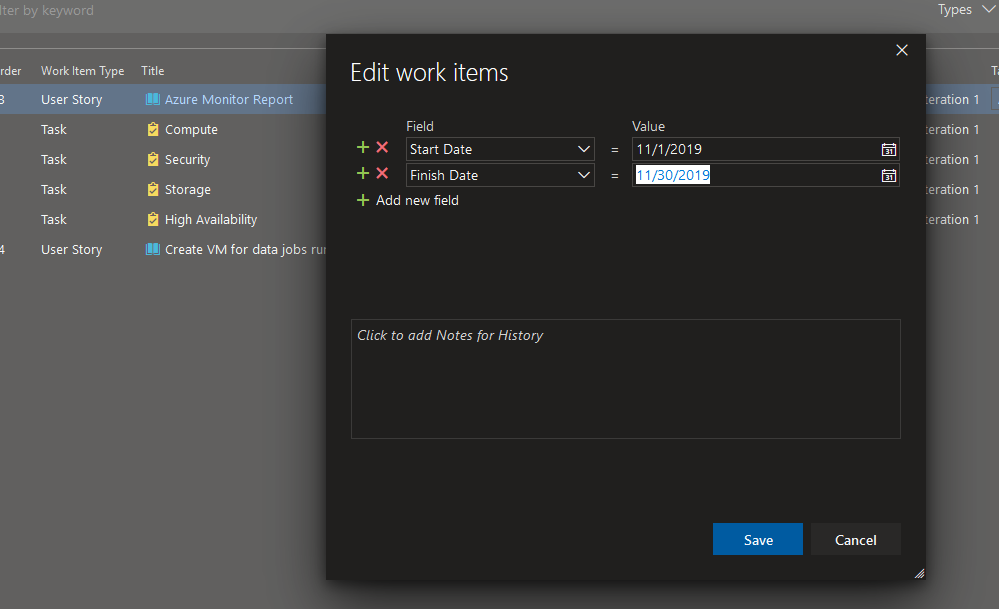
- Add start date and end date for each tasks. The Admin can change the layout to make these two fields visible on edit page, but I can only change them in backlogs
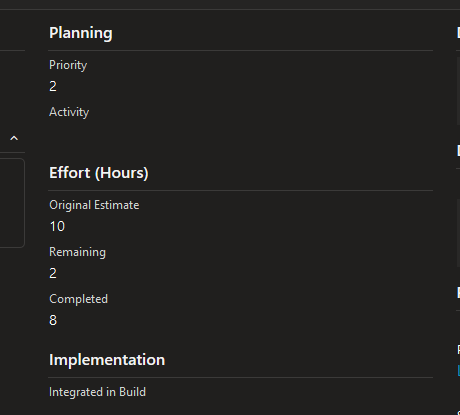
- Add Efforts information: estimate time, already done and left hours. The picture blow shows I have done 80% ‘s workload.
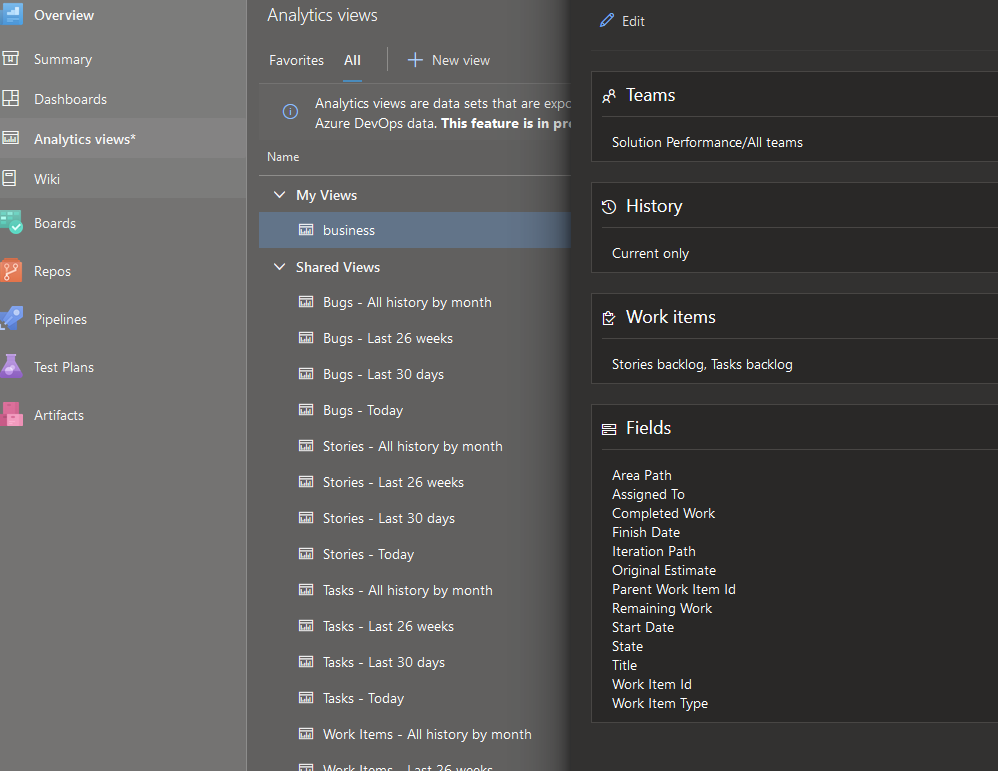
- Create a view for listing all user stories and tasks. ( one time effort for extracting the data)
- Two solutions:
- Power BI: read directly from azure to get all projects information. ( I will show steps blew)
- Use Microsoft Project to get user stories ( license required) https://www.youtube.com/watch?v=vmQjDJ01iso
Power BI steps:
- Download Gantt plugin. https://appsource.microsoft.com/en-us/product/power-bi-visuals/WA104380765?tab=Overview
- Install Gantt plugin by click three dots and import.
- Import data through “Get Data- More – Online Service – Azure Devops(beta)”, then choose the view you created in Devops.
- set the Task, start date, end date, % complete for Gantt chat.
Leave a Reply