— 03/26/2019 version 0.1
In the field of BI tools, the three wildly used are Tableau, PowerBI and Qlik. According to Gartner’s report, all of them are leaders in the market. although there are some difference in features and operations, I think they can do the most of typical visualization work. (Don’t compared them with D3 or matplotlib, the complexity and target customer are totally different)

The downside of this situation for the BI developer or data analyzer is that you have to learn all of them since you never know your company or clients environments in advance. So, like Einstein said:
“The measure of intelligence is the ability to change.”
― Albert Einstein
I touched Qlikview almost 7 years ago, compared with SSRS, it brought new ideas and quick access ability for BI. And 3 years ago, I started to use Tableau, I never thought it could be so easy and fast developing. In this post, I will share some ideas through compare Performance, Visualization, Suitable , ETL, LOD or Set analysis, Table calculation, Tooltips, Sets/Filter/Group etc between Qlikview and Tableau as a developer used both of them.
- Performance. Qlikview and Tableau are both working well in performance. They use in-memory tech to accelerate the speed. You won’t feel much difference when use them to handle the data with small or middle size ( less than 1 million). But above this size, Tableau is slower than Qlikview since Qlikview is only based on your RAM, Tableau uses cube and RAM. The speed of Qlikiview more depends on your design in your model where the more sync tables the more computation to refresh data, that’s the reason of slow Qlikview.

- Visualization. Tableau provides a fashion, simple, drop-drag method to operate the dashboards. It is very quick to develop a new dashboard without do much modeling work. Qlikivew provides relatively complex but flexible dashboard and tables. Yes, you are right, “Table” is much better in Qlikview. and another advantage is drilldown, the cycle drill down feature is convenience for managers to find the key points in the lower level. However, as to Map function, I have to say, Qlikivew has much to learn from Tableau. In Tableau, you can: 1. set map by country, state or latitude, longitude 2. import spatial file 3. set custom image as map, and set x, y coordinate.

- Suitable: in a nuts, Tableau is good for both end-user and IT; Qlikview is good for IT. Tableau is better to develop dashboards and rapid developing for specific purposes, like sales growth analysis. Qlikivew is better to develop enterprise BI solution( all in One). It is easy to understand since Qlikview is based on its model which connects everything together and reveals on the UI.
- ETL. Both of two companies said they can do some part of ETL work. In my opinion, neither of them can replace ETL tools, their tools for ETL are simple and armature. Maybe Qliview doing a little better in incremental loading with QVD files. Without incremental loading, Tableau cannot handle large size data. Hope it can solve it soon

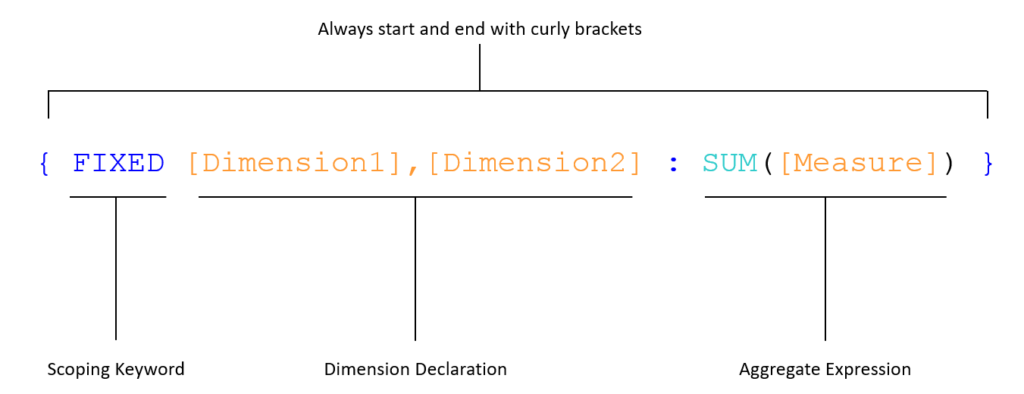
- LOD or Set analysis. Level of Detail(Tableau) and Set analysis(Qlikview) are my favor features. It allows us to control one or more dimensions. The only difference is set analysis allow developer to set value for specific dimension.


- Table calculation. This feature and Tooltips are two my favors in Tableau. In Qlikview, except simple percentage and cumulative sum, you have you code by yourself, like rolling sum “sum(aggr(rangesum(above(total sum({
<Month=> }Amount),0,3)),Month))” . However, in Tableau, Table calculation gives more convince experience. Also you can choose effect area between table and pane.

- Tooltips. This is my second favor feature in Tableau. Long time ago, I was hoping Qliview could provide subchart in tooltip. But until now, it still can only text context in tooltips.

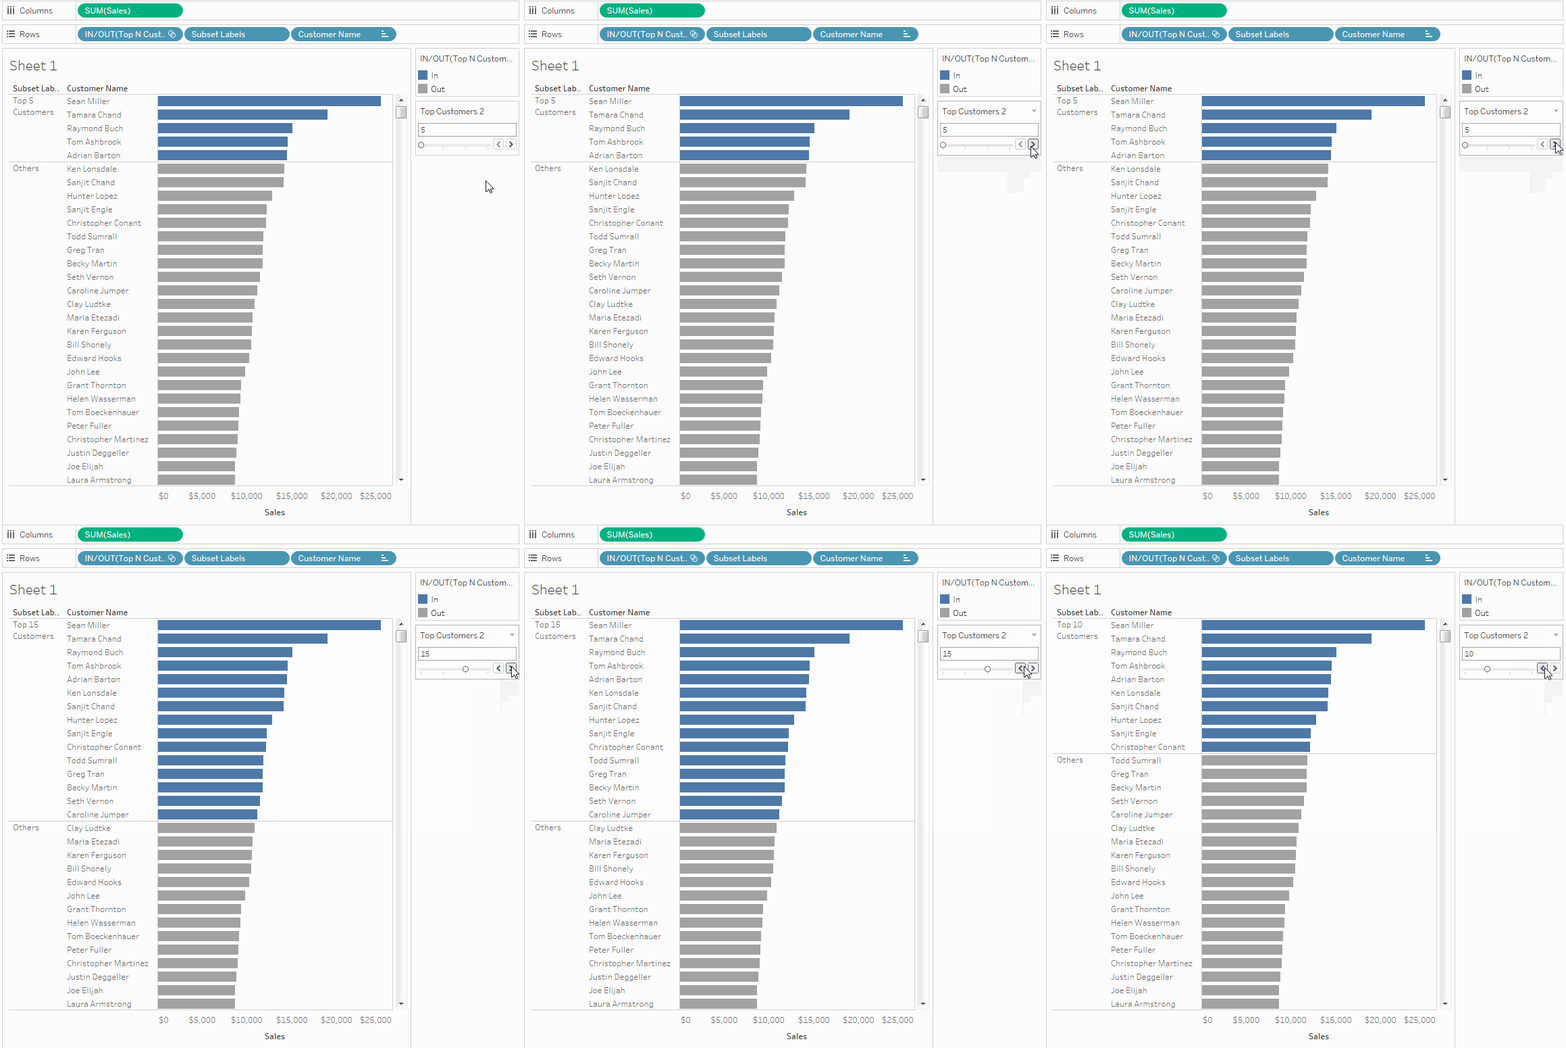
- Filter, Set, Group: In Qlikview, there is no corresponding concept. Filter is only fields in the control panel; set is much like bookmark; and group is mostly done in the script. In Tableau, you need to set filter repeatedly with its working scope; set is a dynamic sub dataset, you can set compute set or in/out set in the global or region level; group is static sub dataset in the region level. From Qlikview point, it is hard to understand “Set”, but it is just a True/False flag essentially.

- Others. Qlikview can do lots of work in its script, I mean everything you can image since it includes vbscript in module function. It seems tableau can do jscript as well, but you won’t want to use it. Tableau provide “Story” feature, the user won’t need to export to PPT to do the second developing.
I didn’t mention some soft or hardware features, like rapid prototyping ability or device supporting. I will put them in the future poster.
Leave a Reply