At the beginning of my optimazation, I tried to find some standard principles that can quickly and smoothly help me. Altough lots of information online that indicate where I can improve my spark, none gives an easy solution to fix the key issues from end to end. So, I summried what I understand through online materical and apply some strateges to my spark notebook which I found may have some performance issues.
- Start with the some slow jobs, you can order by “Druations” column. Some guides may go to the details of slowest stages. But here I suggest go to the related SQL Query page to review the whole process on the query level. It will help us to quickly figure out the common query performance issues, like duplicate scans without filters or inappropriate join, etc.


- One table read multible times. If we found one table is scaned multiple time at the beginning, we may consider create caches to save the temporary result into the memory/local disk, rather than go through the remote disk.

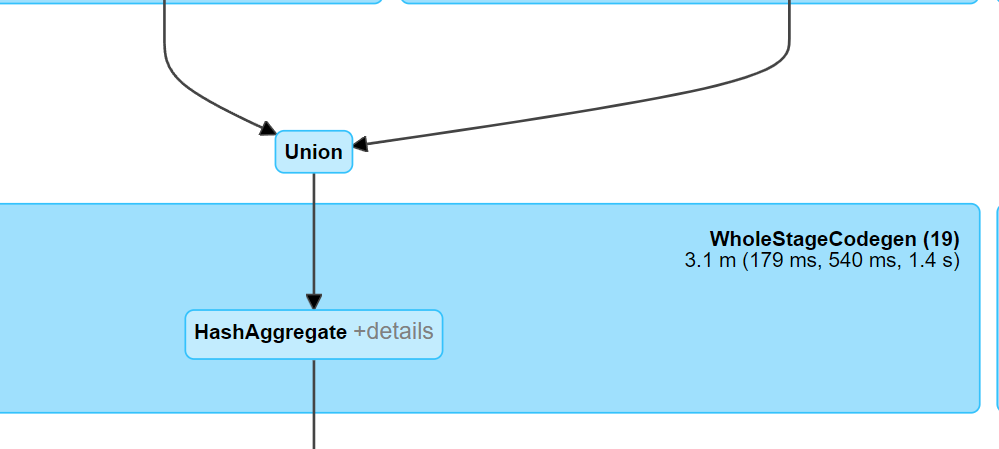
- Too many similar branches. If we see many similar branches, it may be caused by lack of cache too. The medium results have to be recomputed when reaching the point where we need it.
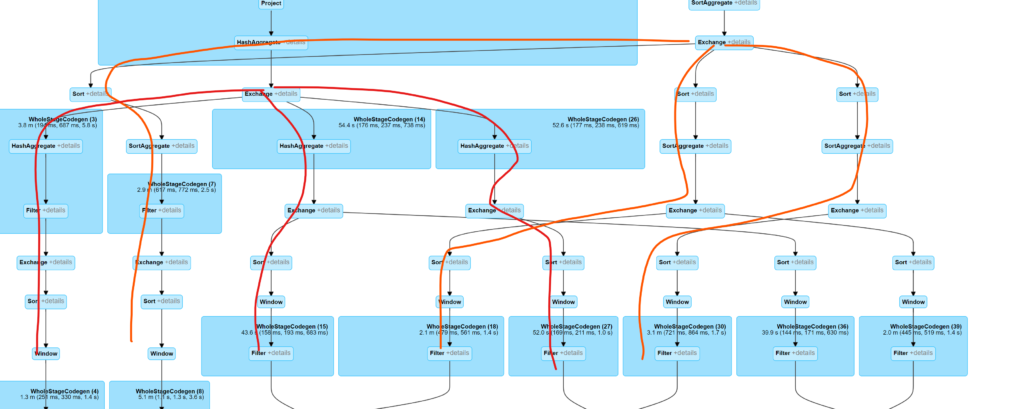
- Duplicate slow stages seem in the stage tab. It may caused by uncautioned code mistake. The case blew shows same dataframe execute computing twice. But this piece code is very normal in python.


To cache table is like blew:
sqlContext.cacheTable('mtu_dcu_trans_reading')- Figure out strange operations. This process will take longer time compared with previous two. We need to match the DAG to SQL in the notebook and understand the wide/narrow shuffle. Then pick some wild shuffle we didn’t expect.
- Reduce data size by adding project to select the columns we need. I think this is the easiest way to improve the performance, especially for the big tables.

- Reduce data size by using filter as early as possible. We can check if filter push down into scan, or manuly move the filter when read the table.
- Corroctly partition destination table. When are use Merge or Replacewhere, it is better to partition correctly.

- Reduce spill. When executor is out of memory, it will spill into disk which is much slower than memory. To solve this issue. we can do one or more of following steps:
- Increase executor memory by change a bigger cluster or set spark.executor.memory(if workable)
- Increase the fraction of execution and storage memory(spark.memory.fraction, default 0.6).
- Adjust spark.memory.storageFraction(default 0.5). Depend on when the spill occurs, either in cache or shuffle, we can adjust storage fraction.
- Adjust spark.sql.shuffle.partitions (default 200). Try to increase shuffle partition size to avoid spill.
Reference:
Spark Configuration, https://spark.apache.org/docs/2.3.0/configuration.html
Performance Tuning, https://spark.apache.org/docs/latest/sql-performance-tuning.html#performance-tuning
From Query Plan to Performance: Supercharging your Apache Spark Queries using the Spark UI SQL Tab, https://www.youtube.com/watch?v=_Ne27JcLnEc&t=553s
How to Read Spark DAGs | Rock the JVM, https://www.youtube.com/watch?v=LoFN_Q224fQ
Optimize performance with caching, https://docs.microsoft.com/en-us/azure/databricks/delta/optimizations/delta-cache
Leave a Reply